
She is a Senior Interactive Designer at Google and has a nutso-fabulous resume.
Figuring out what to build and how to build it really well is a very important part of our jobs and data is a great way to do that.
We’ve all been in situations where we don’t agree with team members or people in our company or clients on what is the most important next thing to build and
When she was an undergrad in Boston, she had a mentor named John Maeda and he said ‘when people have opinions, people just listen. You’re an undergrad, if you have an opinion you’re going to need data to back it up.’
They set up a table where they surveyed passerby’s about cooking data to help explain to the Japanese cooking company to explain why the project she thought they should make was a good idea and the data they had supported that.
Data is often the purview of marketing departments but rarely is something that UX gets involved in and she thinks that’s a huge miss. The world is moving toward data-driven design and the more involved we can be in collecting and understanding it the more we can be involved in the important conversations.
So how can we use data in a product setting?
First of all let’s talk about what she means by data:
Big Data – you have lots of numbers and from all this noise you’re able to identify a small signal. An example of this is when you get a call from a credit card company verifying you made a purchase. We’re not talking about that today.
Internet of Things Data – connected devices. Sensors are in refrigerators in grocery store chains across the company and see how energy is being used and how we might be able to reduce our energy cost by 40%.
*Analytics Data* – how people behave when using your product. User behavior. This is the sort of data that is most useful for people developing those products.
She did a survey to see where people are getting data and she got a lot of interesting info.
We’re going to discuss:
Tools & Resources
Cross-Platform
Data Strategy
Out of this info she created a top 10 list of challenges people have with working with data:
10. “I don’t have the skills or the time.” You won’t get junk data if you’re targeted. There are tools (like Google Analytics) can help detect anomalies or spikes, and they can help you figure out where to focus.
9. “Page Views and clicks are not useful to me.” This is a historical way of looking at the web. You let the data you’re trying to collect drive the design. Now there’s a user based model and instead of just page views and clicks we have different events we’re now tracking. If you work in the mobile world you may be aware that your app may only have 1-3 pages. Most interactions are gestures and things like that. For example you can trigger an event for every letter someone types into an input and send metadata along with those events and return results. You can see what people are searching for – even though there was no submit button so you can’t send the search terms on button click.
8. “My service isn’t just a ______.” So if you work on a product that is more than one single thing (like an app, an offline component, etc). How do you then pull in data from different sources? The way Laura has found to deal with this is kind of manual – it’s kind of like a journey map. analytics.facebook.com/blog has an automated way to do this, they can track the same person across different places if you’re logged into the messenger app. You can put together a general sense of what’s going on.
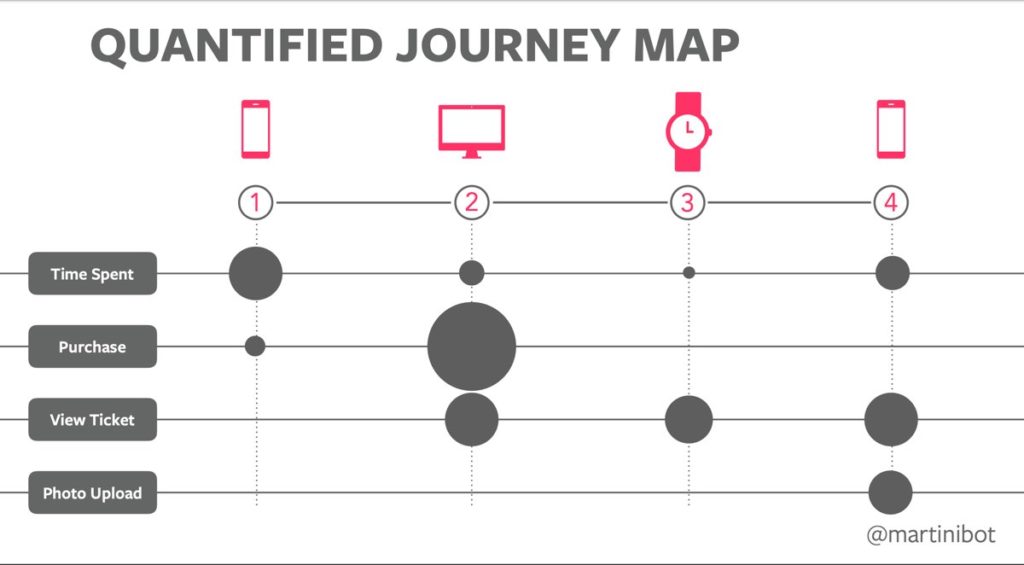
Let’s say you’re ticketmaster – you have an app and someone spends a lot of time but don’t complete a purchase, then that person goes to the desktop and quickly makes a purchase, and then they view the ticket on their watch and view the ticket there, and then they go back to their phone and spend a little more time and view their ticket and upload a photo.
Well if you didn’t see this data in this map you wouldn’t realize that people are journeying across your platforms, and you might decide that you need to invest a bunch of money increasing the purchase rate on mobile, really when you might not have an issue.
7. “I don’t have many users.” She analyzed a day in the life of a physician using an app that had both a mobile and web version to see what they were doing and discovered that the mobile app was used for a very short period of time in the morning to do a base check on everything and then that was it, all day. The rest of the day they were on the web app and she identified something they needed to adjust in terms of defaults when someone logged in by looking at the data and events for one day and one person.
Fullstory is a great tool that can give us data that may make more sense to us than bucket of data. It can show us what one person did in their
6. “Old Data isn’t useful.” Data programs are getting much better about having real time data which allows for more use cases.
Back to Firebase (tool). If you want to do a gradual release of a new version of software to 1 million users, you need realtime data to assist with that gradual release.
It’s not really about having fresh data but even looking into the future. There’s a tool called ‘churn’ that identifies people who are using a product that will likely stop using it in the future. You can then take some actions based on that. You can target them with messages or what have you. This is a prediction so it’s not perfect and you can adjust the algorithm if you want.
5. “I don’t know which questions to ask.” Start with a strategy first, and then collect the data. She thinks it’s better to collect fewer data points but be very very targeted. Use a framework, as well.
The HEART Framework is very UX Centric:
Happiness (C stats or NPS Score)
Engagement ( how many people and how long)
Adoption of new features
Retention (how long are people sticking around)
Task Success (are they doing the things you want them to do?)
It is important that you have some sort of framework and yo have at least a rough idea of what you want to do before you start using the product.
Once you figure out what kind of data you are looking for, you can break it down into a Goal, a Signal, and a Metric.
Also if you can passively track something you’re going to get better data than directly prompting someone with a question.
Having a strategic framework around the data helps talk to other people about it.
Not everybody has a fully-online service, but there are ways you can still do this.
4. “How do I answer those questions?” How do you make data actionable? There are a lot of questions people have.
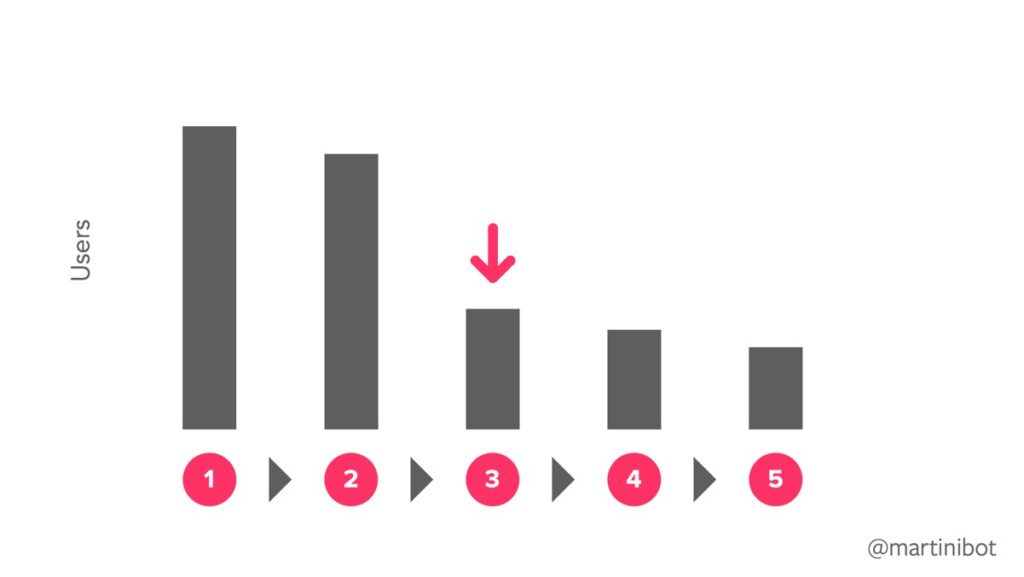
One thing you can do is to set up a funnel. You have a bunch of steps, a certain number of people start the first step, and by the time you’re at the end, not everybody has made it. They usually have a sharp drop-off between one step, so you can identify that drop-off, look for the problem, and fix it.
They had a funnel like this for an app that required people to go through several steps to checkout in a medical process, and 5 out of 6 people dropped on the step where they had to enter their insurance information. So they were then able to discuss ideas on how they can reduce that drop-off and were able to measure improvement.
A/B Testing is another way to make data actionable. Systems can come up with users that are likely to churn, and you can target these users with A/B testing. Group A might be people you email and Group B is a control group. There a cool toll where you can go check to see if you have enough people to execute a successful A/B test.
3. “Data is not the full story.” Data is a key tool to help us understand the high level ‘what’ of user behavior, but we still rely heavily on qualitative data to understand the ‘why’?
2. “My colleagues don’t believe in data.” This is interesting because this isn’t a technical issue, it’s an organizational issue. We’ve talked about scaling data and the technical complexities of things. But where most people fail is teams just aren’t bought in. So we need to be creative on how we create a culture of data especially where that culture may not exist.
In one small agency no one was in charge of product development and checking to see improvements, so they made a ‘competition’ on a whiteboard where people would guess the improvement rate for the launch or release and someone would ‘win’ with the closest guess and get a mirrored ball placed on their desk. It didn’t force participating but made this kind of ‘everybody’s job’ and people paid attention.
Another thing you can do is create a dashboard. It’s less about the tool and more about the conversation you have prior to creating it. Saying ‘what’s important to our company?’ Is it conversion rate or is it based on the HEART framework? Then you decide what your key results will be and everyone will know to go look for those in the same place.
There’s a tool called DataStudio (datastudio.google.com/data) that lets you bring in data from a bunch of different places. You can also share this with leadership. You can also just take a screenshot and point out key pieces of data you want leadership to see.
1. “I don’t want to be a creep.” Treat other people’s data like you’d want your own data to be treated. Be careful. Even if you’re not trying to capture things like if you have a search box on the site and people might accidentally put their passwords there, try and delete it. Don’t capture any data you don’t need, delete it if you’re done with it.
Proceed with Caution.
In summary we’ve talked about tools & resources, how you adjust your processes if you have more than just a website, and also how to create a strategy around the data you’re collecting.


0 Comments