
Regine Gilbert| Designer, Educator, Author An Event Apart Online Together – Fall Summit 2021 3:45pm Central
Intro: Regine Gilbert is a user experience designer, educator, and author, with over 10 years of working in the technology arena. She believes in making the world a more inclusive and accessible place. Her work includes integrating inclusive design practices across every aspect of training and mentoring in corporations. Over the past couple of years, Regina has been a collaborator for Adobe’s Inclusive Design Education Program. She is an industry assistant professor at New York University and has been a consultant for large and small brands. She’s here today to talk about how data and sound can be brought together. Please welcome, first-time AEA speaker, Regine Gilbert
Hello everyone, my name is Regine Gilbert, and today I’m going to be talking to you about accessible data and sound. I am a designer, educator, and author, currently an industry assistant professor at NYU Tandon School of Engineering, Integrated Design and Media program. Before I get into the bulk of the talking about accessible data and sound, I want to first start with some terms that I think we should all get familiar with. And the first one is Ableism.
Ableism is discrimination and social prejudice against people with disabilities or who are perceived to have disabilities. Ableism characterizes persons as defined by their disabilities, and as inferior to the nondisabled. Ableism is systematic, the institutional devaluing of bodies and minds deemed deviant, abnormal, defective, subhuman, less than. Ableism is violence.
So some questions to ask are:
- Do you include people with disabilities in your design process?
- Are your design solutions intended to be used by your future self?
- And does your product promote an inclusive language?
Another is Assumptions. We all have them.
Assumptions, our inferences and ideas are often based on assumptions that we haven’t thought about, critically, a critical thinker is attended to assumptions because they are sometimes incorrect or misguided.
So question to ask are:
- What are your assumptions about what the people and the context that you are researching?
- And have you double-checked the truth of your assumptions?
There’s bias
Bias is disproportionate weight in favor of or against one thing person or group compared with another, usually, in a way to be considered unfair. Self-correction against implicit or unconscious bias takes a lot of conscious work.
So a question to ask is,
- have you acknowledge your bias, and try to counter them by trying to understand the perspective of others.
Justice (Social)
Social justice is concerned with the just relationship between individuals and their society. Often, considering how privileges, opportunities, and wealth ought to be distributed among individuals.
So a question to ask yourself is,
- how can you use your design concept to advance a social justice agenda?
Marginalization
Marginalization is the process where something or someone is pushed to the edge of a group, and is treated as insignificant or peripheral.
So, questions are,
- how does your design disrupt the marginalization of people.
- If you work with marginalized groups, how will you ensure that the work is developed from their perspective and not your own
Self-awareness
Self-awareness is having a clear perception of your personality, including strengths, weaknesses, thoughts, beliefs, motivation, and emotions. Self-awareness allows you to understand how other people perceive you, your attitude, and your response to them in the moment.
So a question to ask yourself is
- how can you become self-aware enough to realize how self-aware you are not?
Transformative Research
Transformative research is a synonym for emancipatory research. It is a research framework that centers, the experiences of marginalized communities includes analysis of power differentials that have led to marginalization, linked research findings to actions intended to mitigate disparities, and has an agenda for change.
So, question is,
- how is your work transformative?
Unlearning Oppression
Some everyday practices seem normal and go unquestioned but discriminate against minorities. Many well-intended people are unaware that their actions are oppressive. Oppression affects both the oppressed and the oppressors, to unlearn oppression, we must acknowledge our everyday oppressive practices and engage in critical self-reflection, with the aim of becoming actively anti-oppressive.
So, a question to ask yourself is,
- What will you do to unlearn oppressive behaviors?
And you
You play an active role in change and transformation, you have the agency to question what is happening around you and take action as a response. Design may be one form of response.
So the question for yourself is
- What are the attitudes needed to be a manager, change agent, facilitator, or researcher?
I think it’s very important for us as designers or whatever role we have that has an impact on design to get familiar with these terms, and I highly recommend The Designers Critical Alphabet by Leslie-Ann Noel, Ph.D. It is available on Etsy. This is something that I use with my work. It’s also something I know others use in their work to look at things with a more critical lens. So I want to go back to you for a moment. And in just a second but I first want to say that this presentation is based upon work supported by NASA under project Eclipse Soundscapes: Citizen Science Project, award No. 80NSSC21M0008, and this is with the Advanced Research and Inclusion and STEAM Accessibility Lab ARISA and NASA. Here I have an image of the Earth, with the moon, near the earth.  So, where are you right now? You could be in your office, you could be at home, you might be in the car, you might be in a park I don’t know, but here I have an image of the Milky Way galaxy in which the solar system is situated and there you are somewhere there. And then there’s the sun. So I want to get a quick little science. I’m not a science teacher at all, but I would like to go over a little bit of science, for this particular project. So, the sun, mainly has four layers. The core. The Corona, the Photosphere, and the Chromosphere. So I have an image of the sun, with the center, being the Core on the outside is the Corona, the Photosphere is within the Corona and the Chromosphere is also within the Corona. During the solar eclipse, the moon moves in between the Sun and the Earth. And here I have an image of the sun on the left and the Earth on the right, and the moon a little bit in between the two. So, The light from the outer part of the sun’s atmosphere called the corona becomes visible during the total solar eclipse. In other words, the sun is hidden by the moon. So here I have an image of North America and South America, and this is the annular solar eclipse path and limit lines, this is happening on October 14 of 2023. This particular image shows the Eclipse, where it ends at sunrise at the maximum. The clip set the maximum during sunrise and also the Eclipse at the end of sunset and the Eclipse at the maximum end of sunset. Here’s an image of the United States, where the annular showing the path of the annular solar eclipse happening on October 14 2023, and then the total solar eclipse happening on April 8 2024. In 2017 Solar astrophysicist Henry tree winter was asked by his blind colleague to describe what an eclipse was like, this led him to think about this question. I also want you all to think about this question. The question is, if you cannot see an eclipse, how can you experience it? When an eclipse occurs, the sound in nature and around you change. For example, many noisy animals go silent at night, while others begin to make noises. Here I have an image that I showed earlier of the Sun and the Earth and the Moon in between. So for example crickets and I’m just going to play a little cricket noise for you all play, of course, we know what cricket sound like and then also night frogs so night frogs may make noise during the eclipse, and also birds will make noise during an eclipse, as well. So, the clips will be happening on October 14, 2023, and the timing of an eclipse, it’s actually not that long, it’s only five minutes and 17 seconds. But those crickets the frogs and the birds are all going to think that that five minutes and 17 seconds is night. And the same goes for April 8 of 2024 for four minutes and 28 seconds those crickets, birds and frogs are going to think that it’s night and make noise. And then once the Eclipse goes away, They’ll be quiet again. So, the original project for the soundscapes of Eclipse, kicked off in 2017. There was an app, which provided sound and haptic feedback. So here I have an image of a person holding a tablet, on the tablet is a sort of full solar eclipse. So the Eclipse Soundscape App launch for iPads and iPhones in 2017 and featured real time narration of different aspects of the eclipse, time for the users location. A lot was learned from that app, it was really cool and funky, and I want to get to 2020, the year that we will never forget. So in 2020, I was volunteering for a blind soldering event so it was an event that was teaching blind folks how to solder for physical computing. And at this event, another volunteer turned out to be Trey Winter, who I mentioned earlier, and he. I informed him that my I teach ux, and that my students always work with real life clients. And in the past my students have worked with the New York Public Library, they worked with Microsoft. It’s been great for them to have real work to talk about when they go for interviews and things, and he asked me a question. He said, “How would your students feel about working with NASA?” And then said I was so excited, I guess, would be so great. But, you know I’m outside it’s like, Oh, that would be cool, you know. So it started a dialogue between us, and then he mentioned that he and his company Ursa Labs was applying for a grant with NASA and asked me and my students to be a part of it. So that’s what happened. We became part of this grant, and the current project will last five years. So, this is not a short project by any stretch, we just started this January, and it’s going to run through 2026. So the goal of the project is to create accessible opportunities for citizen scientists to participate in real and meaningful scientific research that focuses on how Eclipse affect the life of Earth, specifically soundscapes.
 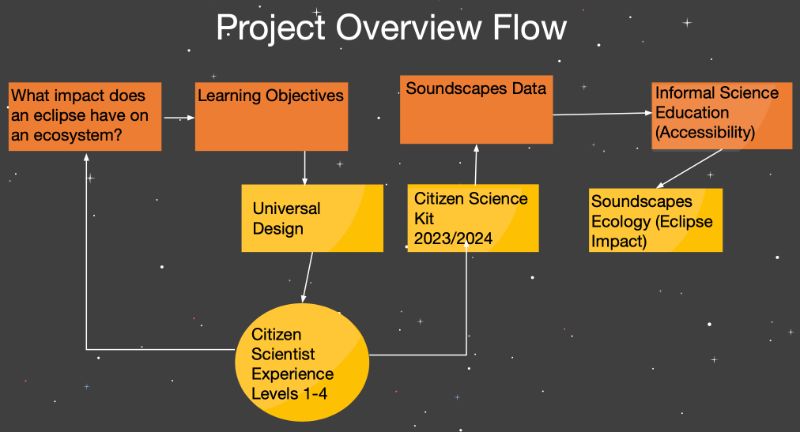 So here’s the project overview. What impact does an eclipse have on an ecosystem, which is the cornerstone of the project. Arrows, continue to the right to demonstrate how the project progresses, we first ensure that the science question aligns with informal science education objectives, and next generation science standards so that the project improves US science and literacy and advances national education goals. Next, we incorporate universal design principles and work with members of the blind and low vision community to develop a project that is not only accessible, but engaging for a variety of learners with diverse needs. We then take input from various subject matter experts in soundscape ecology, education, as well as NASA eclipse subject matter experts, and other partners to create a citizen science expat experience. The citizen science experience will occur twice over the five years of this project. Once for the 2023 annular eclipse, and then again for the total solar eclipse in 2024. Each citizen science experience, we’ll take take place over a period of approximately 15 to 20 weeks before, during, and after an eclipse, using non competitive gamification as a guide the experience has four levels that the citizen science can advance through earning certificates and badges as they progress. At each level citizen scientists will gain the skills necessary to address the science questions. So, the basis of the project is that it builds on expertise gained from the 2017 Eclipse soundscapes project the app that I showed a little bit earlier. And then it’s, this is the main, main part is that it’s made with, not for the blind and low vision communities, and uses Universal Design for Learning principles to create accessible citizen scientists kits, and data analysis interfaces. It also leverages partnerships. And I just want to cover, Universal design for Learning because it’s not something that those outside of education may be familiar with, but it focuses on three areas, and that’s multiple means of engagement, multiple means of representation, and multiple means of action and expression. So, the, the multiple means of engagement is the why. So, this is optimizing individual choice and autonomy, optimizing relevance value and authenticity and minimizing threats and distractions, Multiple means of representation is the what. So, offering ways of customizing the display of information, offering alternatives for auditory information, and offering alternatives for visual information. And then there’s action and expression, so the how of learning. So, this is physical action varying the methods of response and navigation, and optimizing access to tools and assistive technologies. The project partners ARISA labs, Blind and Low Vision consultants, the National Center Accessible Meddia, the National Federation of the Blind, and NYU Tandon School of Engineering, Rainforest Connection, social media experts, developers, designers and science and education advisory boards. We are a big team. So there’s a lot of us working on all kinds of parts of this project. So to get to our part of the project. We’re focusing on the user experience, and the user interface, so in the spring and summer of this year, and my students and I began researching the Citizen Science project so research methods, methodologies that we’ve used thus far literature reviews, interviews, competitive analysis, content analysis, heuristic evaluations of the existing site and previous site, affinity diagramming, prototyping, and some usability testing. So there were a few problems statements that came out of our beginning of the research.
- So, one was the limited opportunities and poor user experience design with sound technology which prevents all users from having a fun learning experience and engaging with accessible information relating to eclipse impact on the environment.
- Another is people want to learn and research about the impact of the eclipse on soundscapes. They need an accessible education platform to visualize and analyze sound data.
- People who are interested in citizen scientists, especially those with visual impairments don’t have access to the necessary information and resources to learn about Eclipse soundscapes. This can be resolved by creating an accessible and engaging web based app that provides a multi sensory experience, containing varying levels of information and data relevant to soundscapes, this web app will be successful based on the number and diversity of the users.
- and people like citizen scientists with or without visual impairments have trouble accessing the Eclipse soundscape sound database and participating in scientific research. This can be resolved by designing an accessible and engaging user interface. We know we’re right when a larger audience is able to access and engage successfully with the site. This can be measured by the increased number of people using the site.
So some research insights that we’ve we found are that
- simple language will work best for the site.
- Adaptable user interfaces tailored for the user to unique needs. For example, enlarging font size on a page or a skip to main content button.
- Quick, easy options to choose a sound recording from
- able to choose recording from a keyboard as well, and search bar to filter results and voice accessible search features.
- In addition to that high contrast images and text for readability
- can use text input from the keyboard so alphabet keys to navigate and discover page,
- compatible with text to speech so the user can use a screen reader
- compatible with speech to text for the search feature and
- interface kept at minimalistic to avoid overwhelming the user.
In addition, we conducted interviews, both in the spring and the summer, and here’s, you know, some, some feedback that we got to
- make the design fun and engaging by including colors.
- Make sure web application that’s accessible on tablets and phones,
- Give users opportunity to share with friends,
- High contrast images and text for readability.
- Using keyboard compatible with text to speech and
- interface kept minimum minimum.
And one of the things that people said was a main frustration were
- websites with poor contrast or unique fonts or heavily size text, and also
- feeling left out of the science community due to lack of access and resources.
So I wanted to share this content model which is a way that I have students work on projects is just before they design a thing is to lay out the content. So, whose audience for this particular page or website? What’s the purpose of this particular page? What are questions audience has? What are the keywords? What’s the browser title? What’s a friendly URL? What’s the page contents, including title and alternative tags? What are images? What are downloads or sidebar on items? And then other page content. 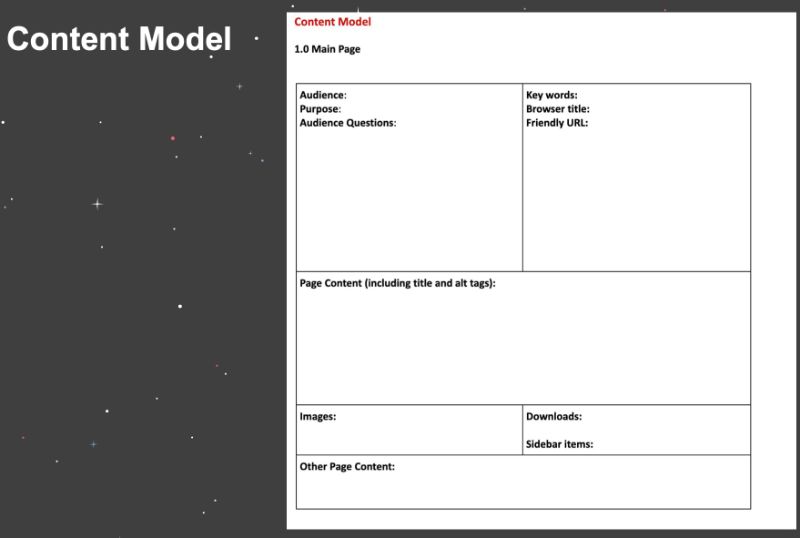 So this has been super helpful, especially when it comes to thinking about accessibility, because when you’re putting in the page content including title and alt tags, you’re taking care of a lot of things already right there. So here’s some examples of wireframes, we have several because we have a bunch of students working on these. but we have several different wireframes that this is an example I wanted to give of the homepage, which has the sound data display, an introduction of the website, the introduction of the lessons, and then getting feedback from the users for the citizen science toolkits.
 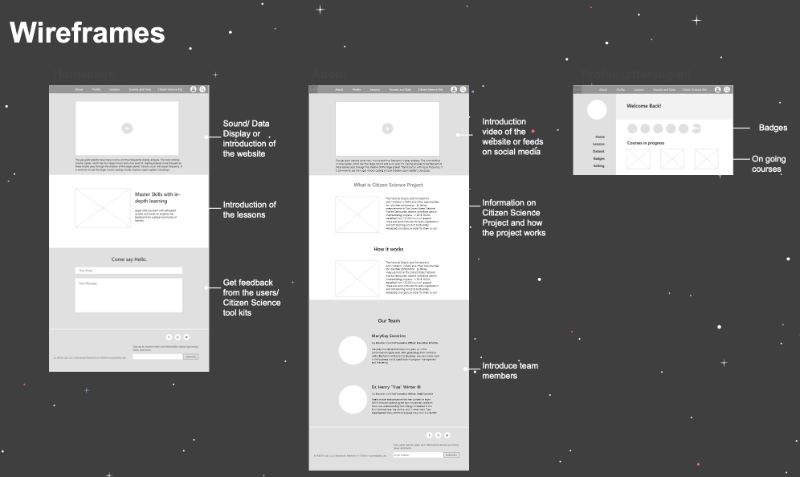 The next page is the about page which has the introduction video of the website, or feeds of social media information on citizen science, and how the project works, and then introduction to the team members, Mary, Kay and Trey. And then for this is the profile and Lessons page has that just an ongoing forces. This is the more of the Lessons page which has sample courses lessons and introductions, information on the four different levels that works to be a citizen scientist, there would be an interactive data map with a dashboard, and then a search for questions for the toolkits. So, what, what makes a website easy to use? One that has accessibility so having high contrast, simple and clear layout and compatibility with native accessibility on Android or iOS, or somebody’s computer. Reducing blue light, and mobile friendly format. What makes our website difficult to use is lack of accessibility, heavy italics, text placed over pictures, unclear ambiguous texts, and difficult to find information. So some key performance indicators that we think would work for well for the site is the percentage change in weekly visitors, amount of time each user spends on the site, increase in users, number of users who finished the lessons, and social shares. So I want to get into the sound recordings, and the data piece. So this is a big piece of the website. What’s going to be happening in the future, is that folks will get this AudioMoth.
 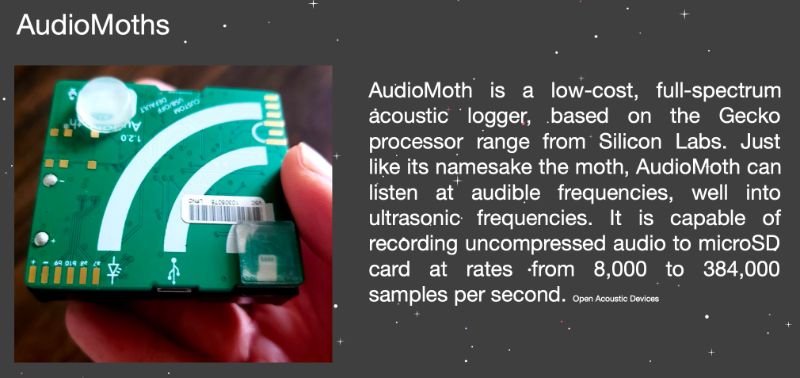 So I want to first tell you what an audio mouth is AudioMoth is a low cost full spectrum acoustic lager, based on the Gecko processor range from Silicon Labs, just like its namesake the Moto AudioMoth can listen at audible frequencies, well into ultrasonic frequencies. It is capable of recording uncompressed audio to a micro SD card at rates from 8000 to 384,000 samples per second. And these are what will be sent to Citizen Scientist, scientists. So, citizen scientists will request and receive audio mods to record sounds during the 2023 and 2024 Solar Eclipse. And so, ARISA labs and consultants have been working on, on this kit, which the kit will contain one small cardboard box containing an AudioMoth audio data recorder, three double A batteries and a pre programmed microSD memory card, which will already be installed, plastic bag, two 14-inch long zip ties, and one bubble envelope pre-addressed to the Eclipse Soundscapes team with postage. However, during this research and discovery phase, It was discovered that instructions were not clear for how to put together the AudioMoth once somebody received all of these things. So this led to the need to do to provide detailed instructions for how to put together, AudioMoths. So this actually added a page to what to the website. Data sonification
Data sonification is the presentation of data as sound using sonification. It is an auditory equivalent of the more established practice of data visualization.
An example applications of data sonification are astronomy studies of star creation, interpreting cluster analysis in geoscience, and also data sonification is being used in this eclipse soundscapes project. So, This is the sound data for Rainforests Connection and Arbimon, so the Eclipse Soundscape website is going to be using an API for this, this Rainforest Connection in Arbimon. So here I have a screenshot of the Arbimon homepage, which allows users to upload audio from their AudioMoth, or other recording devices, and then use the cloud-based tool for analyzing. Here is a summary page so on the summary page on our Vermont, there’s this is giving the name of the particular sound, and a little detail about the sound, the site’s recordings templates pattern matching, and validated species. And here is this additional sound data, latitude, longitude, and altitude. So there’s a lot of challenges when it comes to data and sound, and screenwriter use. If I, I’m just going to go back here for a second to the sound data, latitude, and longitude, and altitude. Not only are those things available the latitude, longitude, altitude, dated number of recordings, but on the left-hand side there’s navigation with species soundscape composition classes uploads recordings training sets templates, playlists, so there’s a lot happening within this page so some of the challenges of data and sound with screenreader use this organization of data must be key keyboard navigable, and data comparison needs to be simplified for screen reader use because it can become complex. Metadata is included in sounds and it can be a lot of information. And the key information for sound needs to be determined by individuals so meaning when someone uploads their information. They’re keying in what it is. If it’s not matching, then it’s not searchable, or if somebody misspells something or something of that nature. So this is visual is the visualizer of the sound. And this, the sound in particular is a bird sound. And this particular page, and I’ll do my best to describe it, has all of the sound data, so you could play, you could rewind you, you can forward you can pause, or you can download the sound. There are tags for each recording. You can look at the species presence validation, training sets which is the rain forest algorithm, templates, which are the pattern matching, analysis, and soundscapes composition. Now, along this sound, you can actually use your mouse or keyboard over a particular area of the sound, which is where thinking about when using a screen reader, what’s, what’s happening here. So, one of the things that we recommend is to think about the data interactivity, and a fully interactive graph where you can select any point along the line, and potentially a tooltip, or a separate table with the actual data so pulling that information and just putting it in text form, and then being able to filter the data lines by sight and differentiating between sight lines using pattern and colors because not only are we thinking about making this site for the blind and low vision community but those with color blindness as well, and selecting a clip space to automatically jump to that part of the recording, click on the phase icons to automatically move to that part of the reporting, keyboard shortcuts for the field guide, and definitely a need for tutorials for reinforce connection because there aren’t any at this time. So some of the insights that we, you know, thought about again are the fully interactive graph where you can select any point along the line filter data lines by sight, and click on the face so all of these icons would need some typography as well with them so that they’re easier to understand what the screen reader. So data comparison and screen readers,
There is a difference between keyboard and screen reader navigation. Although most screen reader users use a keyboard and not a mouse, they are not restricted to the same limited set of keyboard commands as other keyboard users. – Leoni Watson
So in order to provide an accessible experience data needs to be created in a way that works with the screen reader for example tables with data need to clearly state what is in each column and row. So there are ways to make sound data that accessible, and we’re in the process of going through this now but using an SVG format instead of HTML image for screen reader use, as it allows for users to access individual elements on graphs label access, axes, and each tick mark for accessible technology use, labeling each data point, instead of using colors, visuals need descriptive alternative text, providing proper titles to indicate the major insights, associate data cells with appropriate headers, this is something in our interviews that became very… that was a lot. We got a lot of feedback around headers, identity, rows and columns. And then summarizing the data. And a big part, of what can be done, ultimately with this data is storytelling. So, citizen science, science data can tell stories of the changes since the last eclipse, the impacts of climate change on sounds, and unexpected changes in nature, during the eclipse. So throughout this process. Again, we’ve been working on this since January and this is a five-year project, but we’ve learned some things along the way What didn’t work?
- We tried surveys. That did not work at all.
But what did work,
- Our interviews,
- our content modeling,
- participatory design of the AudioMoth and
- getting to work this summer with the National Association of Accessible Media and
- Getting a lot of feedback on, what will and won’t work.
And this is a recommendation for all designers, this is a new book that’s come out by Emily Landau, and it’s just Demystifying Disability: What to Know What to Say and How to be an Ally. This is a great book to learn about ableism and accessibility disability etiquette disability in the media, and mostly how to be an ally. One of the biggest things. You know when I talked to the folks with the ARISA labs who we’re working with. They said, “You know, from the beginning, this project was created with folks in the blind and low vision community. This is not an afterthought, this isn’t something we’re just using, you know, look, we’re going to bring in people for usability testing this is, this is us working with the community”, and I think we all have the opportunity to do this, we all have the opportunity to work with, with our communities. So our next steps are to
- co-design and continue working with the community, because the comparison of data is a challenge. It’s one of the things that working with folks, getting to understand how, how the data works is, is very interesting. So we’re going to work on CO-designing the comparative data,
- Usability testing with the National Federation of the Blind, the prototype, and
- Adding accessibility features so the field guide testing column format testing and model testing and
- implementing more gamification components when it comes to the lesson piece of the site, and t
- hen content creation for lessons with the certification and badges and
- using the Universal Design for Learning principles, and then
- expanding accessibility components so we’re working, we’ve already created a style guide but working on creating design systems with those accessibility components.
Call To Action So, I have a call to action for everybody. We want you to get involved. We need citizen scientists so the ARISA labs advanced research and inclusion and steam accessibility lab, we’re looking for, for you are looking for citizen scientists to participate so you can receive the AudioMoth and you can record sounds during the 2023 and 2024 Eclipse. ARISA is a NASA partner, and you can find them here:  So I want to thank you, thank you for listening. This is a really cool project I’m really happy and honored to be a part of it. I’m really happy for my students to be able to get to work on a project that has incorporated accessibility from the start. And if anyone wants to reach out to me, feel free to email me at [email protected] And you can find me on Twitter @Reg_inee Thank you so much thank you to everyone at an event apart, and have a wonderful day.


0 Comments